Tag: climate action

  • How to make climate reporting fun

    How to make climate reporting fun

    As part of the Paris agreement each country is estimating the amount of greenhouse gases released into the atmosphere. The emissions are then reported to the UN. Think of it like tax time for emissions. The idea is to track and reduce emissions over time. How do countries estimate yearly emissions? Today, a mix of sensor data, survey results, and expert options are used to create an inventory. For the agriculture, forest, and land use sector there are tools to help with this process.

    One of these tools has been developed by climate scientists. It is very well thought out, has incredible features, and allows for maximum flexibility. The catch? It is very hard to use. So we started an experiment: What if we added a user experience expert to the mix and redesigned this as a modern, web-based app?

    To make apps user friendly we start by learning from end users: Who are our users? What data do they have? What are their biggest roadblocks? The wealth of information we get from end users is always humbling. We summarized our insights into three lessons:

    Lesson 1: Guidance: Often inventory teams don’t have enough time and resources to read the complex guidelines provided by the UN.

    How do we guide our users? In depth familiarity with the guidelines is great but not necessary to use our app. It guides compilers through the inventory process and points to specific sections in the guidelines to learn more.

    Lesson 2: Flexible usage. Some teams estimate just one source, while others estimate all sources.

    How do we design for flexibility? We let users choose what they want to do and adapt the experience to their needs. Part of this is approach is to only ask for data if and when they are needed. An advantage is that we are avoiding bottlenecks by not asking for data they might not have.

    Lesson 3: Adjusting complexity. Some compilers have basic datasets with gaps, others have very complex datasets.

    How do we design for different inputs and estimation methods? We ask users what kind of data they have and then tailor the experience to their personal needs. Rather than a static interface, this app guides the compiler through the process. Users view personalized pages based on the complexity of their dataset.

    Screenshot

    How do we make sure this is what users need?

    We started with high level prototypes and constantly iterated to make them better and more accurate. Weekly expert reviews and collaborative design sessions helped with constant improvements. Once the developers had created a working app, we tested it with users. The results were mind blowing:

    • Intuitive: Our test users completed the emission estimation on their own, without any training or help.
    • Easy to use: Our test users entered simple datasets as well as for complex datasets. They navigated the app easily and compared results for the different methods.
    • Fun: This is maybe not the first word that comes to mind when thinking of compiling an inventory, but our test users had fun! They enjoyed seeing graphs, playing with real-time emission results, and tweaking inputs to study the results.

    Where do we go from here? The app is still in development, and we hope to overcome obstacles along the way. Our goal is to roll this out to make climate reporting easier, faster and more accurate.

  • How can we make climate reporting easier?

    How can we make climate reporting easier?

    This story starts in Japan, where the United Nations body for climate reporting, the TFI, is based. Countries all over the world report yearly emissions to the UN. It’s like a financial report but for greenhouse gases. Countries determine their emissions and removals of greenhouse gases and send the final balance sheet to the UN.

    This sounds easy and straightforward, but in fact it’s a highly complicated process. There are tools to help, but most are old. While an enormous amount of experience and thought went into the development of existing tools, they haven’t been designed with end users in mind.

    This is where Seaspray Labs comes into play. We are currently working on a web-based app for greenhouse gas inventories. Like most inventory tools it is based on the guidelines developed by the TFI. Here are our design questions:

    • How can we simplify the inventory process?
    • How can we help and guide users through the process?

    Here are three steps we are taking to tackle this:

    Step 1: Understand the inventory process. When designing interfaces, this step is often skipped, even though it’s so important. How can designers simplify a process if they don’t have an in-depth understanding of it? This step includes user research to see how current users are using existing tools. During user interviews we learned how inventory compilers approach their inventories, and we heard about their struggles with existing tools. In the context of a greenhouse gas inventory, this step also includes understanding climate science and the guidelines for climate reporting from the TFI.

    Step 2: Design a simplified workflow. The majority of our users are newcomers. How can we make the user interface straightforward for them? We identify the actions for a simple inventory every step of the way and hide all other functions. This way, we don’t overload newcomers with information that doesn’t apply to them.

    Step 3: Architect the tool with flexibility. While the majority of our users are newcomers, we also have many expert users. They have more complex datasets and need more sophisticated estimation methods. We need to allow for flexibility. Functions and actions for expert users, such as importing massive data sets, are part of the design to address user needs from basic to extremely sophisticated.

    What do I like most about designing tools for climate reporting? There are existing tools out there. They are not easy to use, but a lot of experience and thought went into their development. It’s a fun challenge to transform them into intuitive, easy to use apps. And hopefully they can help to make climate reporting easier and more accurate.

  • Can an API Make Rice Farming More Climate Friendly?

    Can an API Make Rice Farming More Climate Friendly?

    This story brings us to Vietnam where I presented at a webinar, organized by the IFC, the International Finance Corporation. Thankfully highly skilled translators were able to translate in realtime to and from Vietnamese to allow meaningful discussions across the globe. The topic was ”Digital Disruption in Agriculture Vietnam – GHG Emissions Measurement and Reporting Tools”. My talk covered a joint project from Seaspray Labs and Irri, the International Rice Research Institute.

    In other posts I already talked about the climate impact of rice and how different farming practices can drastically cut emissions. To cut emissions, we need to measure existing emissions and then make ongoing assessments to monitor and reduce emissions. IRRI’s scientists have developed highly accurate rice emission calculators over many years. These were originally Excel based and Seaspray Labs partnered with Irri to develop web-based versions of the calculators. Now we are going one step further and developing an API. It will allow partner organizations to access IRRI’s calculator in their own apps and services. This is how it works:

    This is how the API works for a fictional carbon credit app for rice farmers. The app gets rice farming information from its end user. These are the inputs the API needs to calculate emissions. The API then sends the results back to the app and the app can present these results meaningfully to its end user.

    This is one example I showed in my talk. A second example showed a very different app for a very different user group. I mocked up a regional planning app. Vietnam wants to reduce methane emissions by 30% by 2030 and moving to low-carbon rice production will play a major role. My mockup shows how a planner can adjust the percentage of low farming practices and traditional farming practices to explore emission reductions of entire regions by 2030.

    These are just two examples. The API is currently in development and I’m excited to see what other ideas IRRI’s partners will come up with. Hopefully these apps and services can translate into climate action for rice farmers, agriculture organizations, food companies, and consumers to reduce our carbon footprint.

  • How Can We Measure Climate Change Better?

    How Can We Measure Climate Change Better?

    Do you know how much money is in your bank account? How many calories does your white chocolate mocha have? How many steps did you walk today? We measure many aspects of our lives but when it comes to climate change our measurements are vague, and often nonexistent.

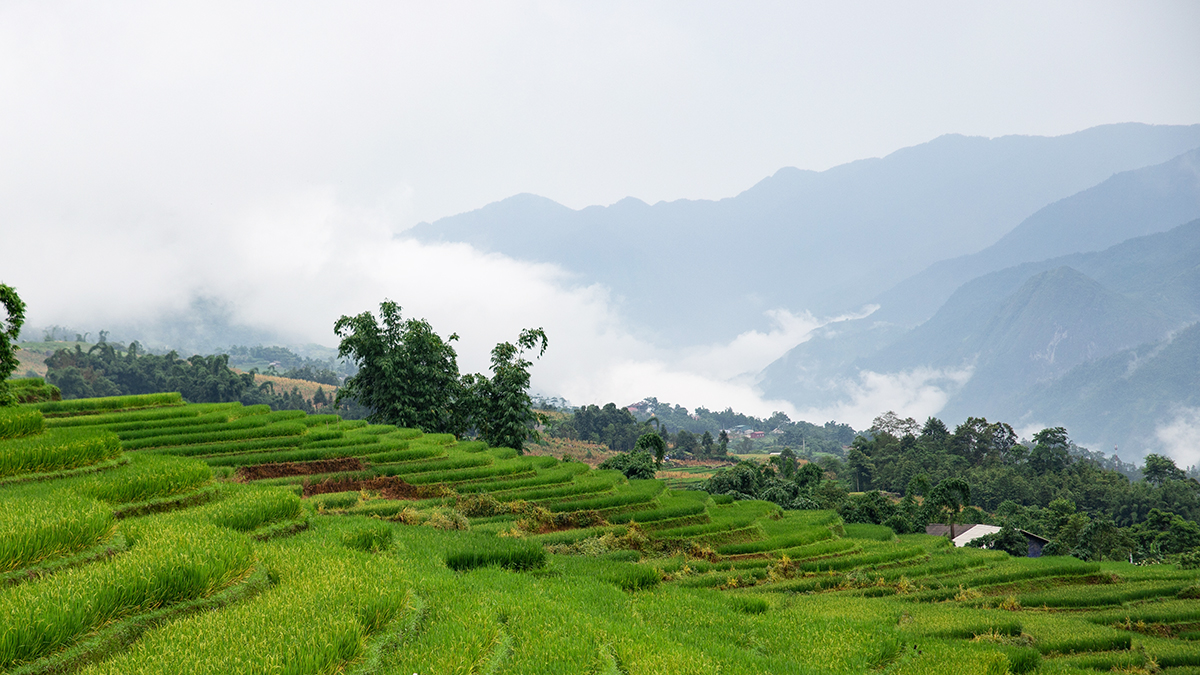
    This week’s climate story brings us to the beautiful rice paddies of Vietnam. Seaspray Labs partnered with the International Rice Research Institute. IRRI’s climate change team is based in Vietnam and they are working on carbon accounting tools for rice. Rice farming releases a lot of greenhouse gas emissions. Traditional techniques such as flooding rice paddies release the potent greenhouse gas methane. The good news? Changing farming practices can drastically reduce emissions while still producing the same amount of rice.

    We designed a web-based carbon calculator for rice growers, rice companies and scientists to better understand how different farming and processing methods for rice effect greenhouse gas emissions. We had three goals going into the project:

    • Easy access: Reach a bigger audience though a web-based tool
    • Intuitive experience: Provide a straightforward user experience
    • Understand data: Display data charts to measure, understand, and plan low emission practices

    While most team members were in Vietnam, we also interviewed partners and end users in the Philippines, Thailand, India, Germany, and the US. This was followed by rapid prototypes to learn how users might use the calculator. Through different iterations and continuous feedback, the tool improved quickly. After the final development and testing phase the calculator got successfully deployed. You can read more about our process here. In early tests with the recently released calculator we see the following results:

    • Easy access: Instead of installing a tool and having to cater to different operating systems the web tool successfully allows ad hoc access in lectures and webinars.
    • Intuitive experience: Streamlined pages guide users through the complex task of entering data for growing, processing, and transporting rice. It works well for novice users but also supports efficient expert data entry.
    • Understand data: Visual results allow users to view and compare the carbon footprint of different rice products. By comparing different farming and processing methods users can explore how to best reduce greenhouse gas emissions.

    We partnered with an amazing team of scientists and implemented the tool within weeks. Let’s hope it helps rice growers, rice companies and scientists to adopt low emission practices for rice. And let’s hope for more tools to measure the climate impact of the food we eat, the products we purchase, and the things we do.

  • An Unexpected Ingredient for Climate Action

    An Unexpected Ingredient for Climate Action

    This week’s climate story brings us all the way to the island Tasmania in Australia. Imagine standing next to a beautiful bay overlooking the Tasman Sea, this is where the company Sea Forest is headquartered.

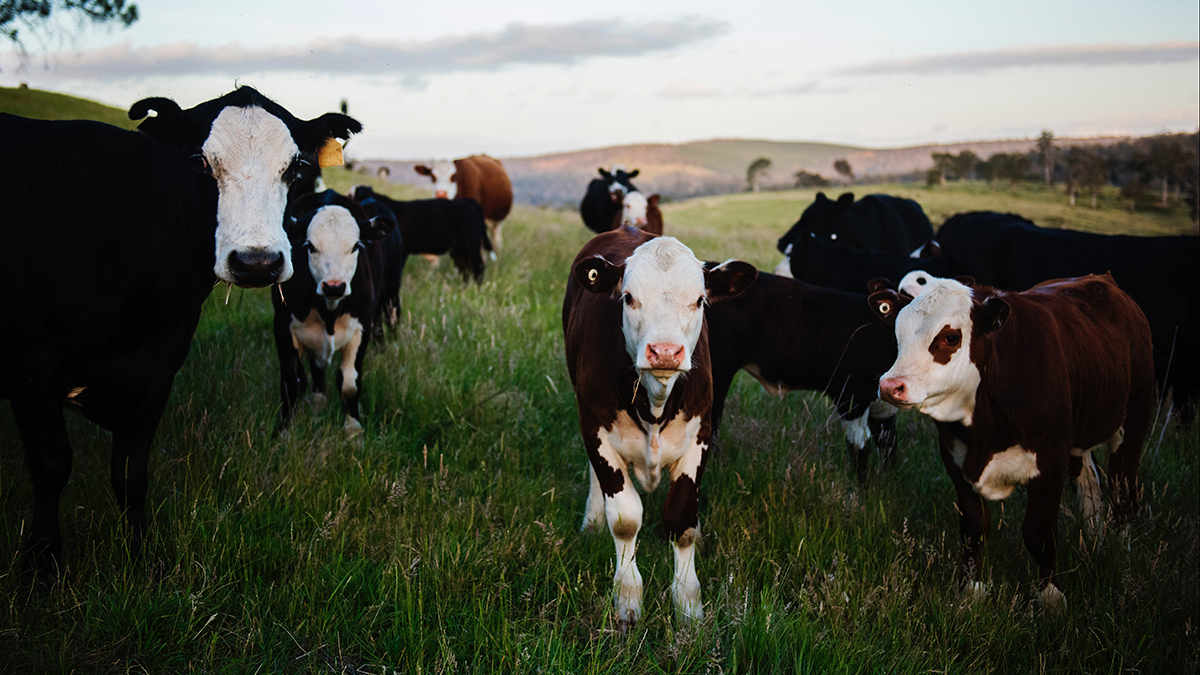
    Have you heard that cows release the potent greenhouse gas methane? Have you also heard that mixing a little bit of seaweed in their diet reduces their emissions greatly? Research teams all over the world are racing to find out more: What type of seaweed works best? How much is needed? How can it be grown and mixed into feed sustainably?

    Asparagopsis is an edible red seaweed, native to Australian waters. Sea Forest is the first company to produce and scale Asparagopsis at a commercial scale. They are developing innovative ways to cultivate the seaweed on land and in the ocean. This is how it works:

    On the left side you can see how a boat farms seaweed in the ocean. Alternatively it can be grown in tanks on land. After it is harvested, the seaweed needs to dry. Sea Forest then produces a feed supplement for cattle.

    No, the milk and meat don’t taste like seaweed. And amazingly, the cows are more productive with this supplement. They need less feed because they are saving energy by not producing methane. A 2020 study found that methane emissions from cattle can be reduced by up to 98%:

    Animals whose diets contain 0.2% Sea Forest’s supplement will have methane reductions up to 98%.

    https://www.sciencedirect.com/science/article/pii/S0959652620308830?via%3Dihub#ack0010

    That is a very impressive reduction of methane! There are still a lot of open questions and scientists say there is not enough seaweed for all the cattle in the world. What I like most about Sea Forest is that they are acting now. We need climate solutions now and Sea Forest is one of the teams delivering. They are planning to sell the first supplements later this year.

    As with so many other amazing teams all over the world, Sea Forest is producing climate solutions right now. Their rapid and innovative approach is inspiring and I hope they succeed!